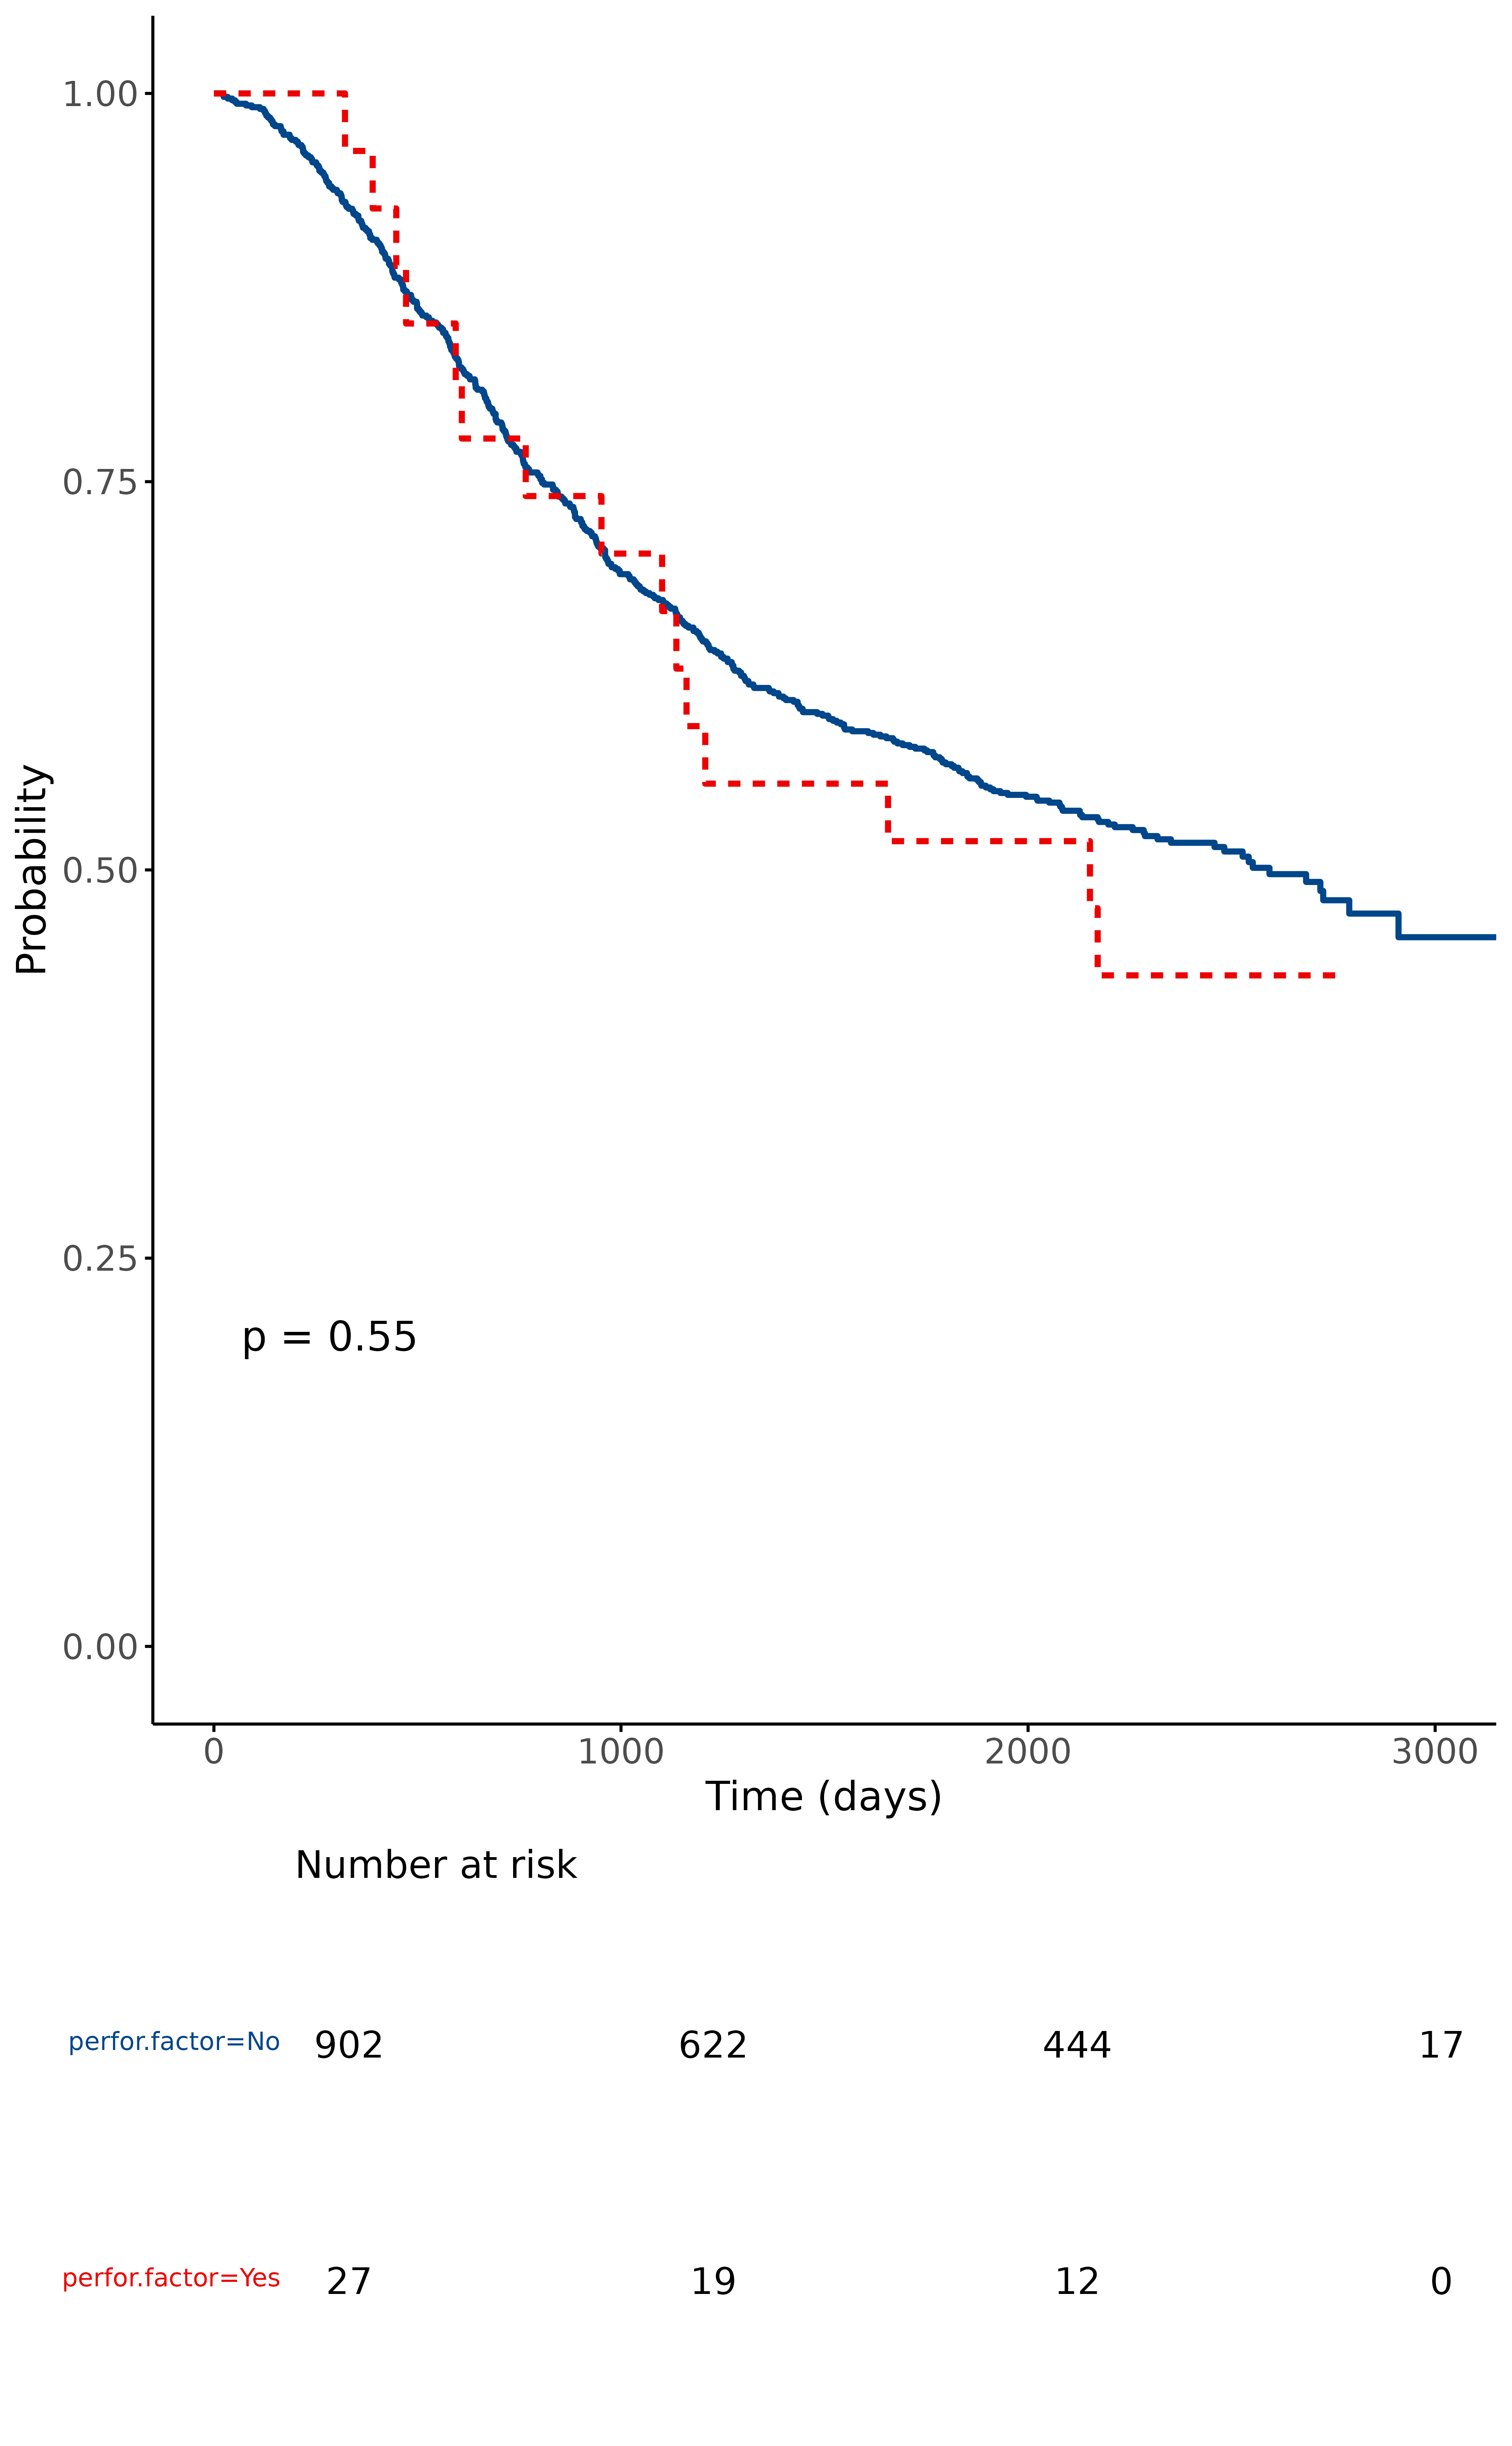
Produce a survival curve plot and number-at-risk table using survminer::ggsurvplot
and finalfit conventions.
surv_plot(.data, dependent, explanatory, ...)Arguments
- .data
Dataframe.
- dependent
Character vector of length 1: Survival object of the form
Surv(time, status).- explanatory
Character vector of max length 2: quoted name(s) of explanatory variables.
- ...
Arguments passed to
ggsurvplot.
Value
Returns a table and plot produced in ggplot2.
See also
Other finalfit plot functions:
coefficient_plot(),
ff_plot(),
hr_plot(),
or_plot()