Produce a coefficient and plot from a lm() model.
coefficient_plot(
  .data,
  dependent,
  explanatory,
  random_effect = NULL,
  factorlist = NULL,
  lmfit = NULL,
  confint_type = "default",
  confint_level = 0.95,
  remove_ref = FALSE,
  breaks = NULL,
  column_space = c(-0.5, -0.1, 0.5),
  dependent_label = NULL,
  prefix = "",
  suffix = NULL,
  table_text_size = 4,
  title_text_size = 13,
  plot_opts = NULL,
  table_opts = NULL,
  ...
)
Arguments
- .data
Dataframe.
- dependent
Character vector of length 1: name of depdendent variable (must be numeric/continuous).
- explanatory
Character vector of any length: name(s) of explanatory variables.
- random_effect
Character vector of length 1, name of random effect variable.
- factorlist
Option to provide output directly from
summary_factorlist().- lmfit
Option to provide output directly from
lmmulti()andlmmixed().- confint_type
For for
lmermodels, one ofc("default", "Wald", "profile", "boot")Note "default" == "Wald".- confint_level
The confidence level required.
- remove_ref
Logical. Remove reference level for factors.
- breaks
Manually specify x-axis breaks in format
c(0.1, 1, 10).- column_space
Adjust table column spacing.
- dependent_label
Main label for plot.
- prefix
Plots are titled by default with the dependent variable. This adds text before that label.
- suffix
Plots are titled with the dependent variable. This adds text after that label.
- table_text_size
Alter font size of table text.
- title_text_size
Alter font size of title text.
- plot_opts
A list of arguments to be appended to the ggplot call by "+".
- table_opts
A list of arguments to be appended to the ggplot table call by "+".
- ...
Other parameters.
Value
Returns a table and plot produced in ggplot2.
Examples
library(finalfit)
library(ggplot2)
# Coefficient plot
explanatory = c("age.factor", "sex.factor", "obstruct.factor", "perfor.factor")
dependent = "nodes"
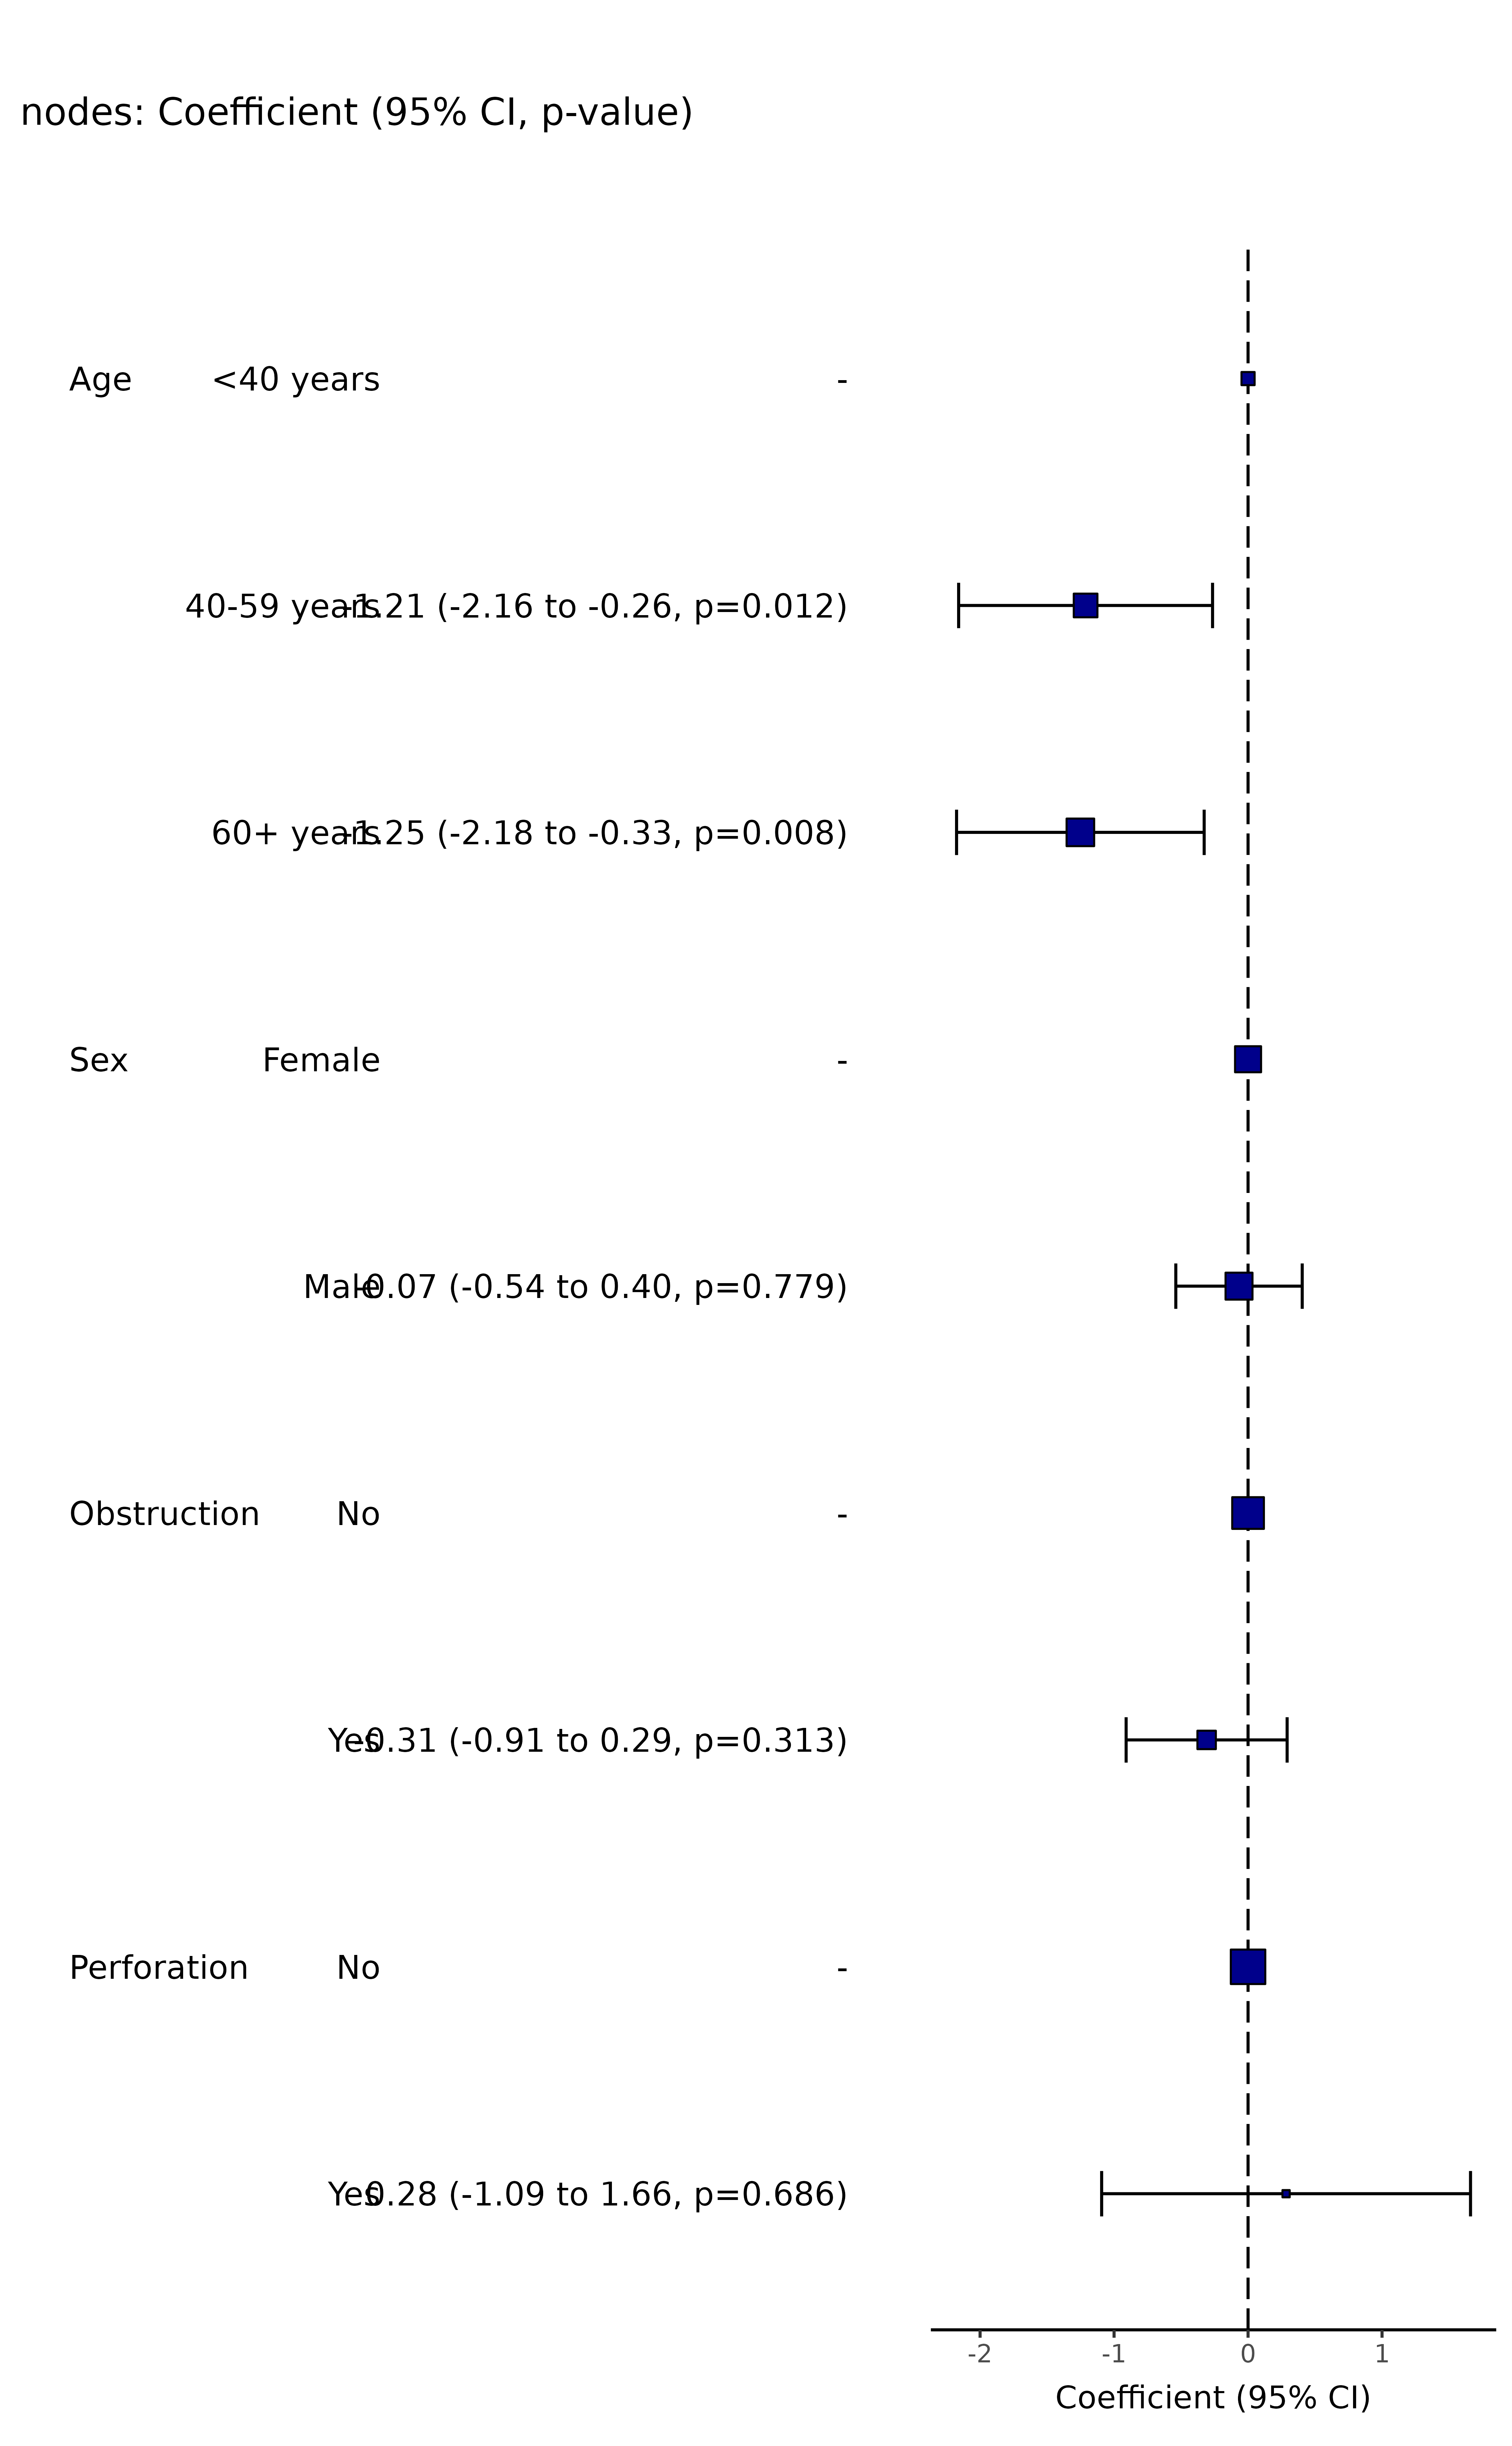
colon_s %>%
coefficient_plot(dependent, explanatory)
#> Note: dependent includes missing data. These are dropped.
#> Warning: Removed 4 rows containing missing values or values outside the scale range
#> (`geom_errorbarh()`).
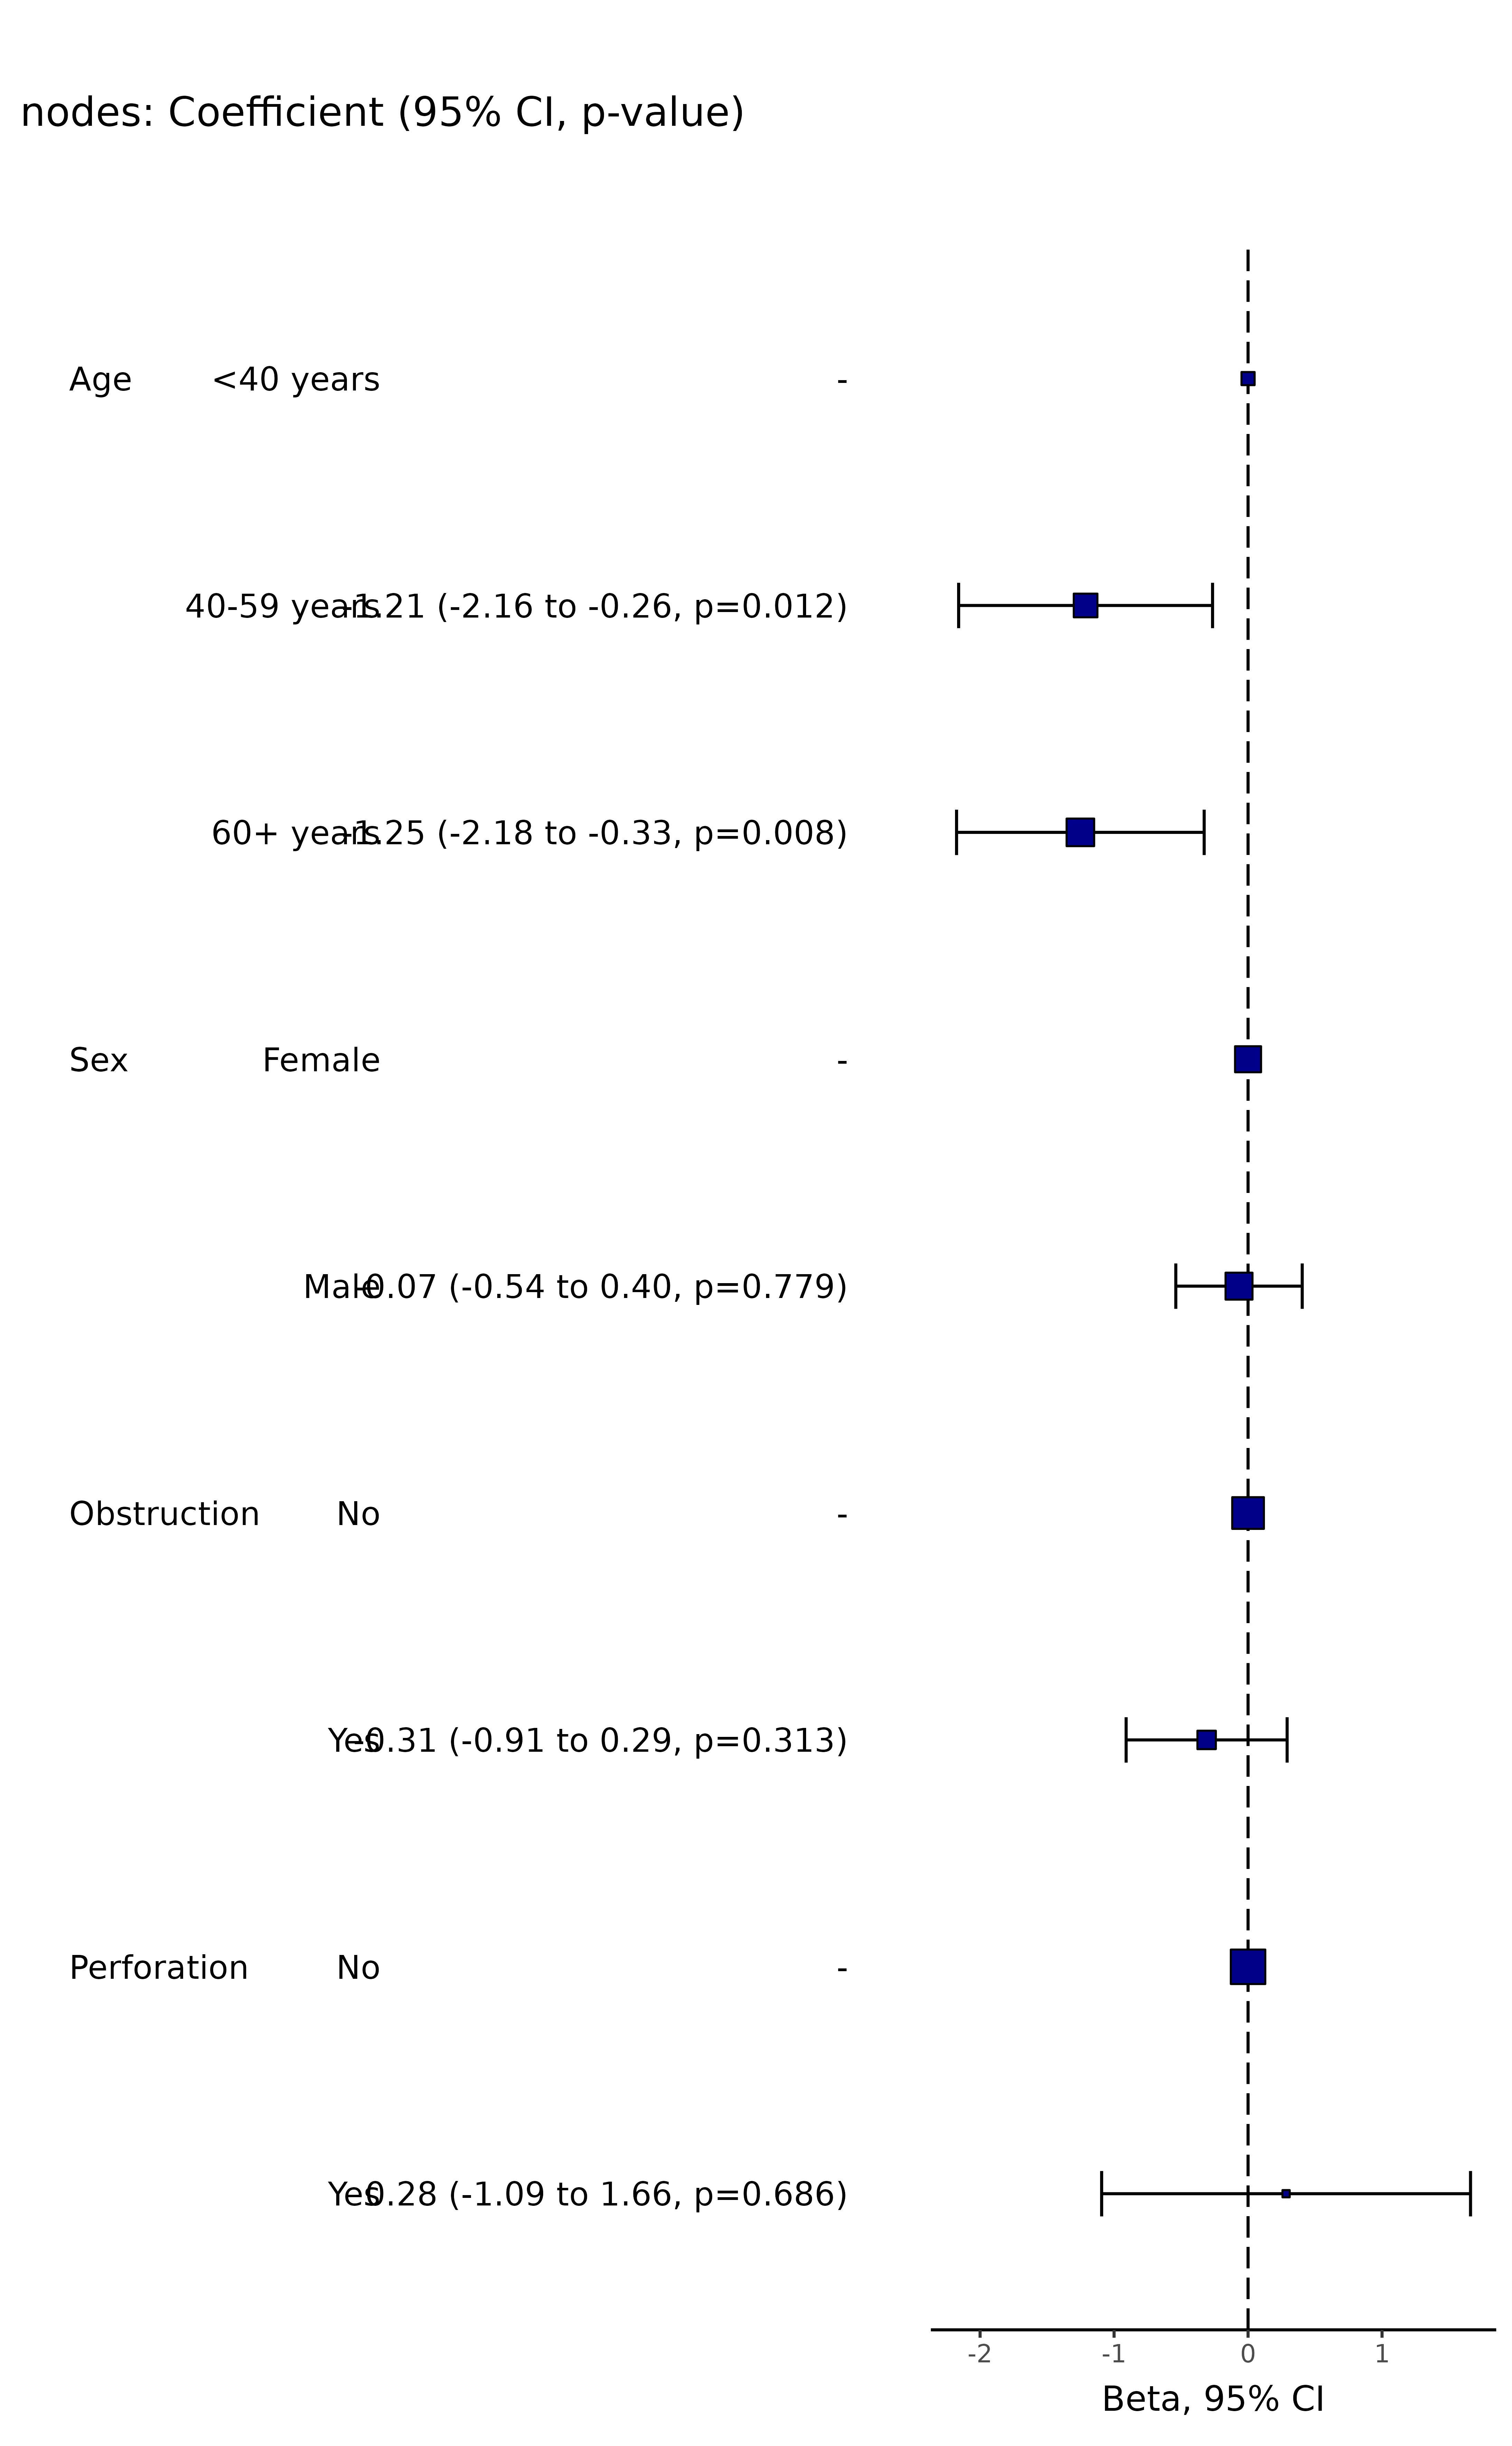
 colon_s %>%
coefficient_plot(dependent, explanatory, table_text_size=4, title_text_size=14,
plot_opts=list(xlab("Beta, 95% CI"), theme(axis.title = element_text(size=12))))
#> Note: dependent includes missing data. These are dropped.
#> Warning: Removed 4 rows containing missing values or values outside the scale range
#> (`geom_errorbarh()`).
colon_s %>%
coefficient_plot(dependent, explanatory, table_text_size=4, title_text_size=14,
plot_opts=list(xlab("Beta, 95% CI"), theme(axis.title = element_text(size=12))))
#> Note: dependent includes missing data. These are dropped.
#> Warning: Removed 4 rows containing missing values or values outside the scale range
#> (`geom_errorbarh()`).