Produce hazard ratio table and plot from a Cox Proportional Hazards analysis, survival::coxph().
hr_plot(
  .data,
  dependent,
  explanatory,
  factorlist = NULL,
  coxfit = NULL,
  remove_ref = FALSE,
  breaks = NULL,
  column_space = c(-0.5, 0, 0.5),
  dependent_label = "Survival",
  prefix = "",
  suffix = ": HR (95% CI, p-value)",
  table_text_size = 4,
  title_text_size = 13,
  plot_opts = NULL,
  table_opts = NULL,
  ...
)
Arguments
- .data
Dataframe.
- dependent
Character vector of length 1: name of survival object in form
Surv(time, status).- explanatory
Character vector of any length: name(s) of explanatory variables.
- factorlist
Option to provide output directly from
summary_factorlist().- coxfit
Option to provide output directly from
coxphmulti().- remove_ref
Logical. Remove reference level for factors.
- breaks
Manually specify x-axis breaks in format
c(0.1, 1, 10).- column_space
Adjust table column spacing.
- dependent_label
Main label for plot.
- prefix
Plots are titled by default with the dependent variable. This adds text before that label.
- suffix
Plots are titled with the dependent variable. This adds text after that label.
- table_text_size
Alter font size of table text.
- title_text_size
Alter font size of title text.
- plot_opts
A list of arguments to be appended to the ggplot call by "+".
- table_opts
A list of arguments to be appended to the ggplot table call by "+".
- ...
Other parameters passed to
fit2df().
Value
Returns a table and plot produced in ggplot2.
See also
Other finalfit plot functions:
coefficient_plot(),
ff_plot(),
or_plot(),
surv_plot()
Examples
# HR plot
library(finalfit)
library(dplyr)
library(ggplot2)
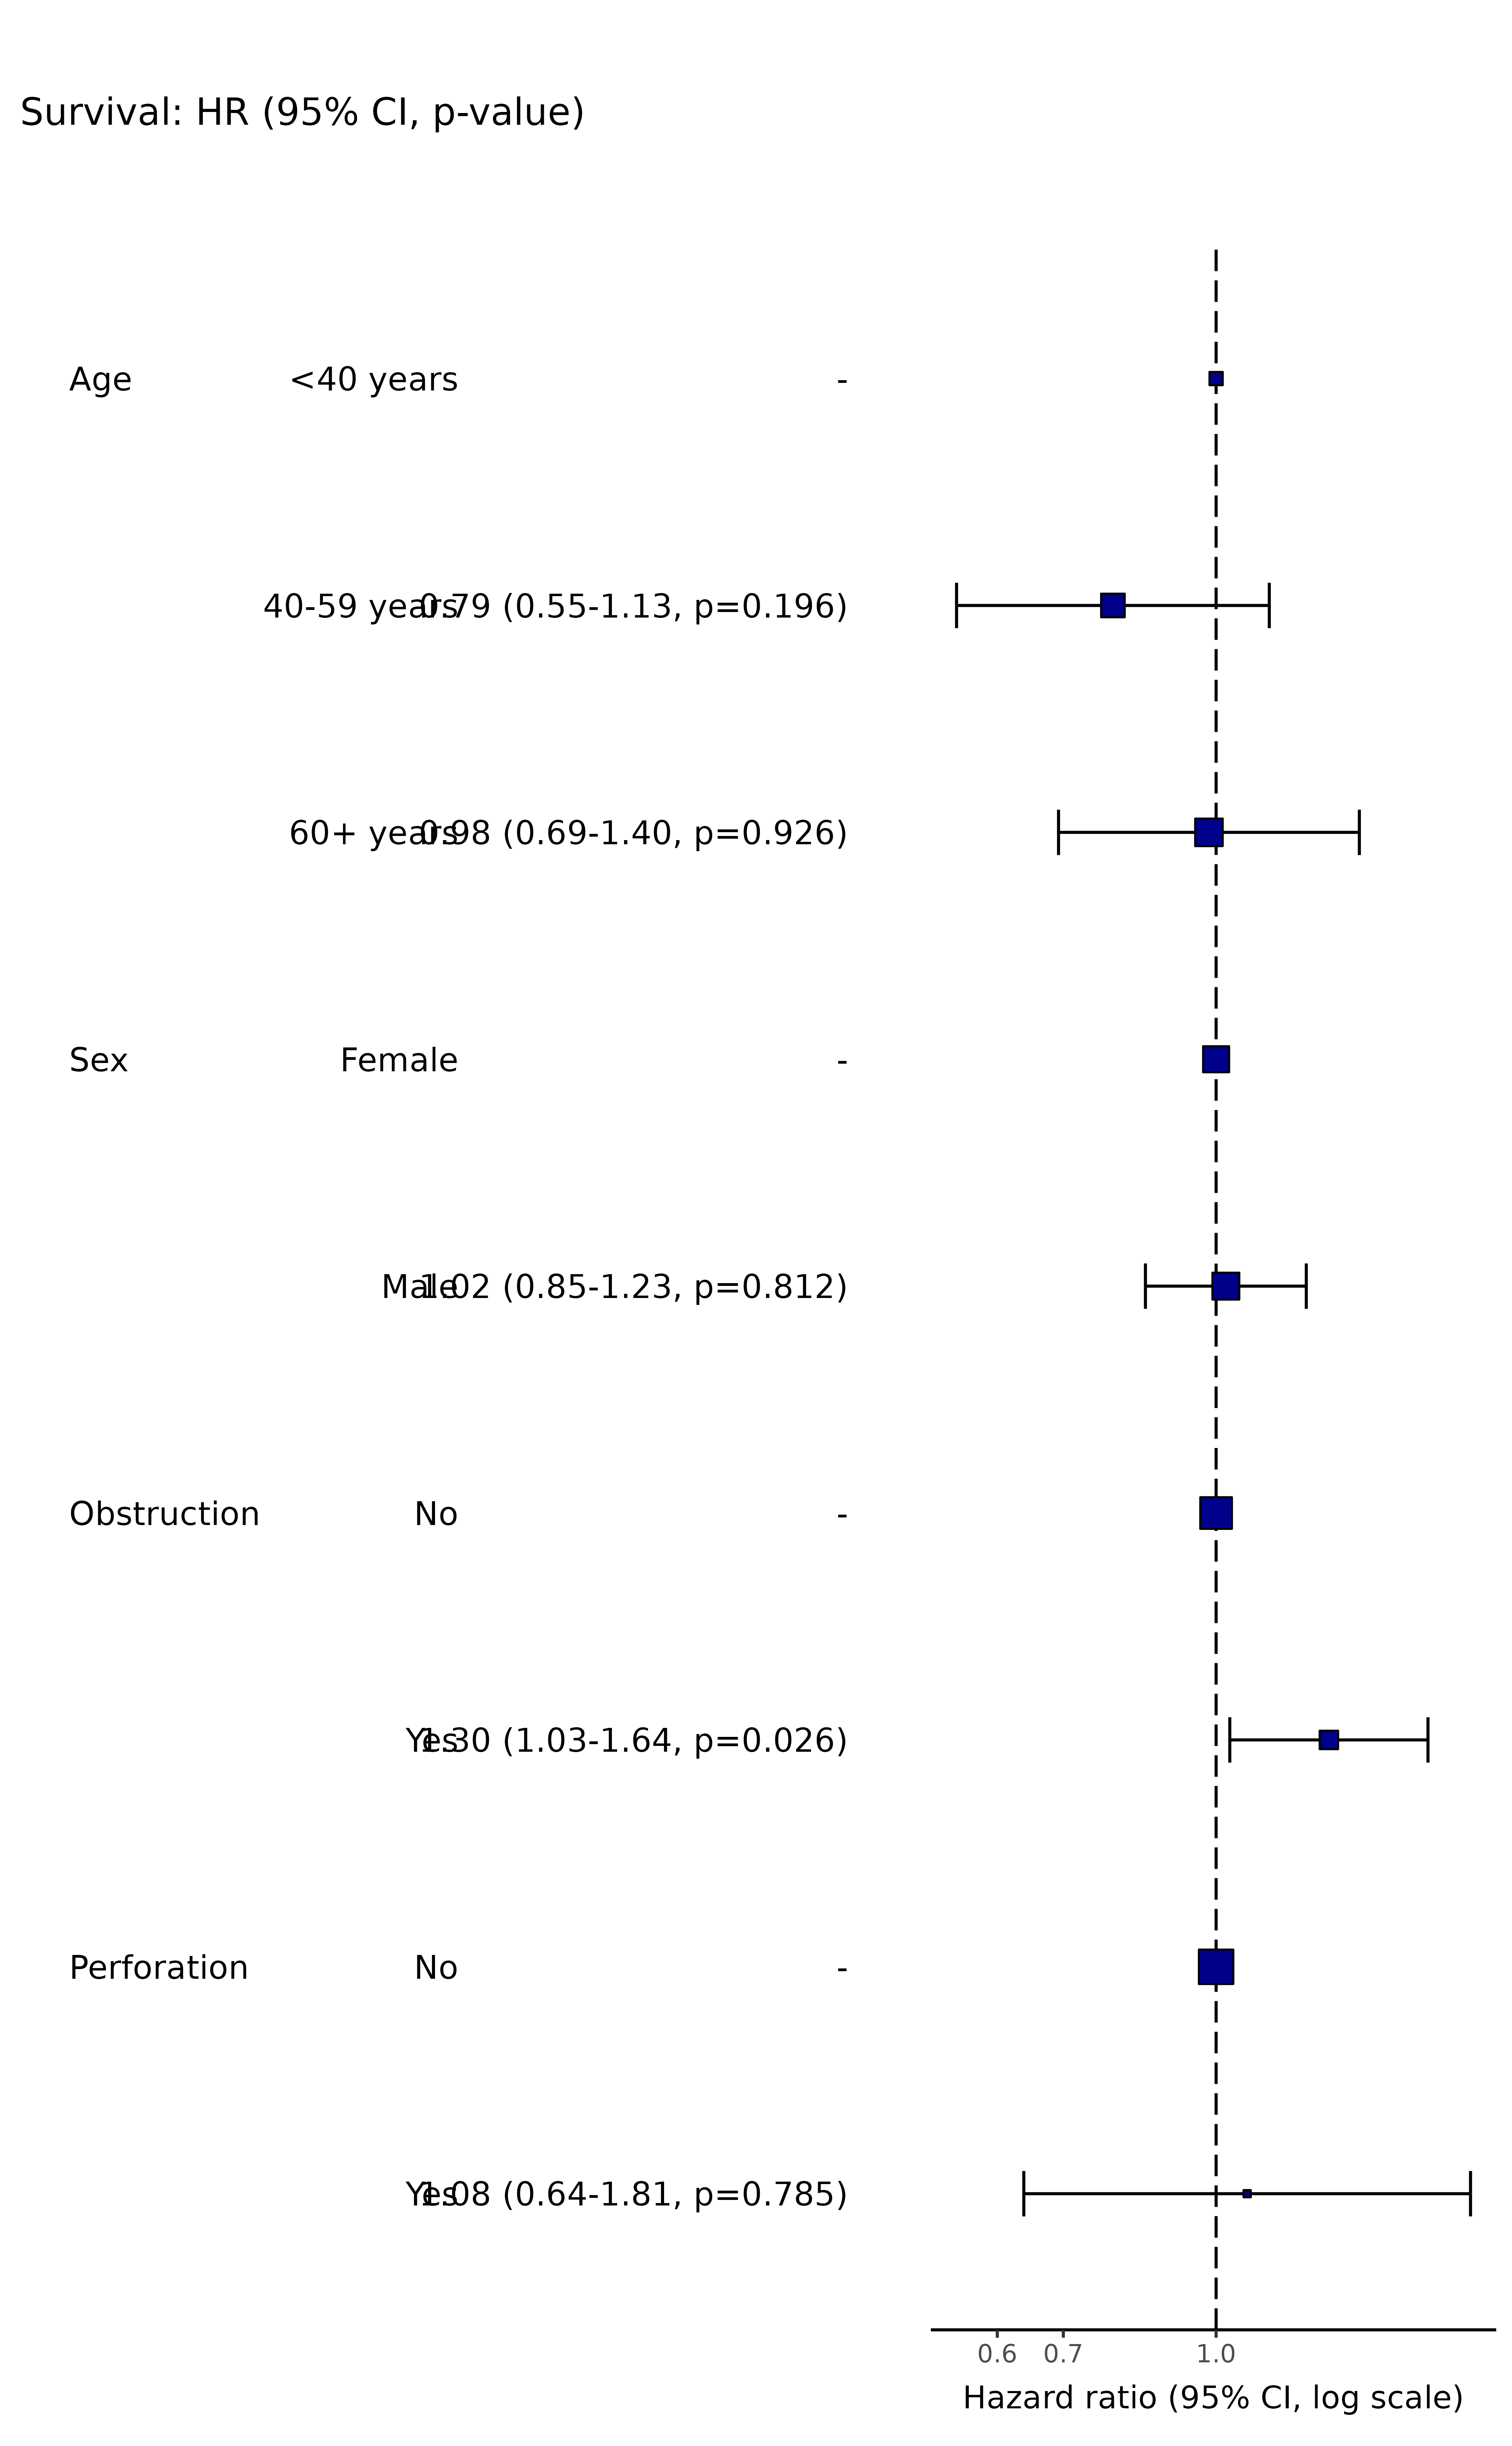
explanatory = c("age.factor", "sex.factor", "obstruct.factor", "perfor.factor")
dependent = "Surv(time, status)"
colon_s %>%
hr_plot(dependent, explanatory, dependent_label = "Survival")
#> Dependent variable is a survival object
#> Warning: Removed 4 rows containing missing values or values outside the scale range
#> (`geom_errorbarh()`).
 colon_s %>%
hr_plot(dependent, explanatory, dependent_label = "Survival",
table_text_size=4, title_text_size=14,
plot_opts=list(xlab("HR, 95% CI"), theme(axis.title = element_text(size=12))))
#> Dependent variable is a survival object
#> Warning: Removed 4 rows containing missing values or values outside the scale range
#> (`geom_errorbarh()`).
colon_s %>%
hr_plot(dependent, explanatory, dependent_label = "Survival",
table_text_size=4, title_text_size=14,
plot_opts=list(xlab("HR, 95% CI"), theme(axis.title = element_text(size=12))))
#> Dependent variable is a survival object
#> Warning: Removed 4 rows containing missing values or values outside the scale range
#> (`geom_errorbarh()`).
