Compare missing data
missing_compare(
  .data,
  dependent,
  explanatory,
  p = TRUE,
  na_include = FALSE,
  ...
)
Arguments
- .data
Dataframe.
- dependent
Variable to test missingness against other variables with.
- explanatory
Variables to have missingness tested against.
- p
Logical: Include null hypothesis statistical test.
- na_include
Include missing data in explanatory variables as a factor level.
- ...
Other arguments to
summary_factorlist().
Value
A dataframe comparing missing data in the dependent variable across explanatory variables. Continuous data are compared with an Analysis of Variance F-test by default. Discrete data are compared with a chi-squared test.
Examples
library(finalfit)
explanatory = c("age", "age.factor", "extent.factor", "perfor.factor")
dependent = "mort_5yr"
colon_s %>%
ff_glimpse(dependent, explanatory)
#> $Continuous
#> label var_type n missing_n missing_percent mean sd min
#> age Age (years) <dbl> 929 0 0.0 59.8 11.9 18.0
#> quartile_25 median quartile_75 max
#> age 53.0 61.0 69.0 85.0
#>
#> $Categorical
#> label var_type n missing_n missing_percent levels_n
#> mort_5yr Mortality 5 year <fct> 915 14 1.5 2
#> age.factor Age <fct> 929 0 0.0 3
#> extent.factor Extent of spread <fct> 929 0 0.0 4
#> perfor.factor Perforation <fct> 929 0 0.0 2
#> levels
#> mort_5yr "Alive", "Died", "(Missing)"
#> age.factor "<40 years", "40-59 years", "60+ years", "(Missing)"
#> extent.factor "Submucosa", "Muscle", "Serosa", "Adjacent structures", "(Missing)"
#> perfor.factor "No", "Yes", "(Missing)"
#> levels_count levels_percent
#> mort_5yr 511, 404, 14 55.0, 43.5, 1.5
#> age.factor 70, 344, 515 7.5, 37.0, 55.4
#> extent.factor 21, 106, 759, 43 2.3, 11.4, 81.7, 4.6
#> perfor.factor 902, 27 97.1, 2.9
#>
colon_s %>%
missing_pattern(dependent, explanatory)
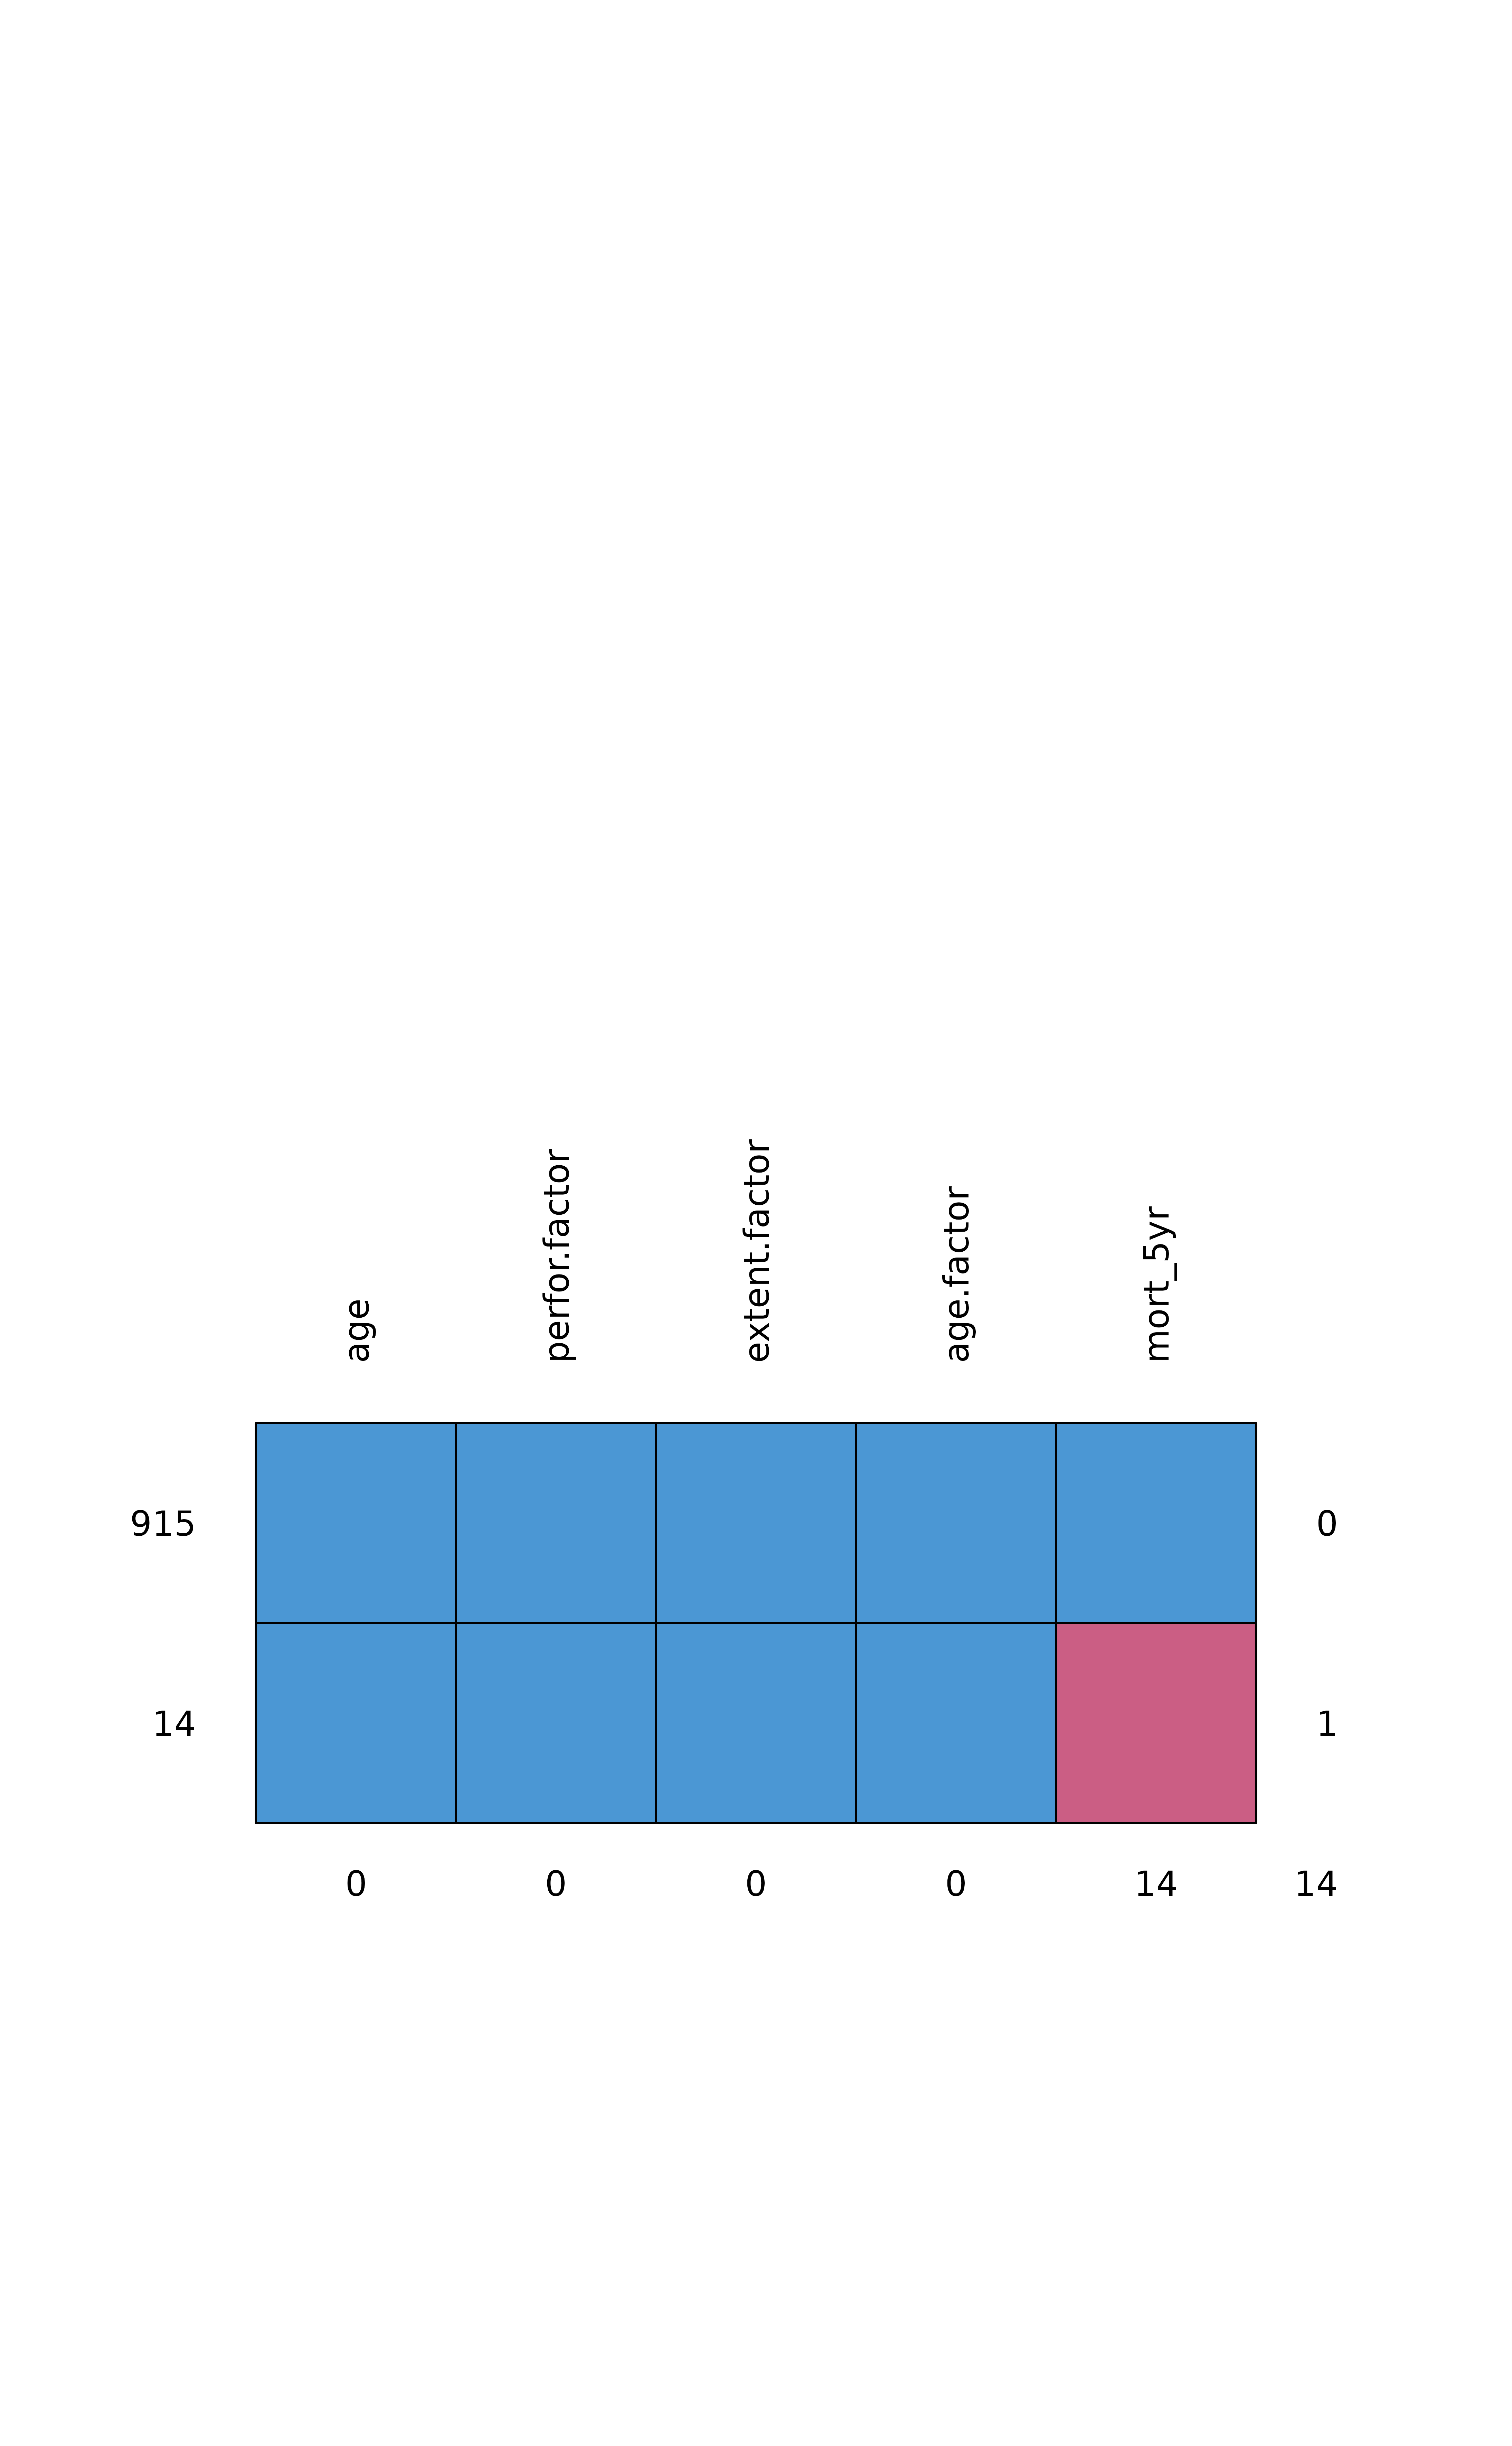 #> age perfor.factor extent.factor age.factor mort_5yr
#> 915 1 1 1 1 1 0
#> 14 1 1 1 1 0 1
#> 0 0 0 0 14 14
colon_s %>%
missing_compare(dependent, explanatory)
#> Warning: There was 1 warning in `dplyr::summarise()`.
#> ℹ In argument: `chisq.test(age.factor, mort_5yr)$p.value`.
#> Caused by warning in `chisq.test()`:
#> ! Chi-squared approximation may be incorrect
#> Warning: There was 1 warning in `dplyr::summarise()`.
#> ℹ In argument: `chisq.test(extent.factor, mort_5yr)$p.value`.
#> Caused by warning in `chisq.test()`:
#> ! Chi-squared approximation may be incorrect
#> Warning: There was 1 warning in `dplyr::summarise()`.
#> ℹ In argument: `chisq.test(perfor.factor, mort_5yr)$p.value`.
#> Caused by warning in `chisq.test()`:
#> ! Chi-squared approximation may be incorrect
#> Missing data analysis: Mortality 5 year Not missing
#> Age (years) Mean (SD) 59.8 (11.9)
#> Age <40 years 67 (95.7)
#> 40-59 years 339 (98.5)
#> 60+ years 509 (98.8)
#> Extent of spread Submucosa 20 (95.2)
#> Muscle 103 (97.2)
#> Serosa 750 (98.8)
#> Adjacent structures 42 (97.7)
#> Perforation No 888 (98.4)
#> Yes 27 (100.0)
#> Missing p
#> 53.9 (12.7) 0.066
#> 3 (4.3) 0.132
#> 5 (1.5)
#> 6 (1.2)
#> 1 (4.8) 0.325
#> 3 (2.8)
#> 9 (1.2)
#> 1 (2.3)
#> 14 (1.6) 1.000
#> 0 (0.0)
#> age perfor.factor extent.factor age.factor mort_5yr
#> 915 1 1 1 1 1 0
#> 14 1 1 1 1 0 1
#> 0 0 0 0 14 14
colon_s %>%
missing_compare(dependent, explanatory)
#> Warning: There was 1 warning in `dplyr::summarise()`.
#> ℹ In argument: `chisq.test(age.factor, mort_5yr)$p.value`.
#> Caused by warning in `chisq.test()`:
#> ! Chi-squared approximation may be incorrect
#> Warning: There was 1 warning in `dplyr::summarise()`.
#> ℹ In argument: `chisq.test(extent.factor, mort_5yr)$p.value`.
#> Caused by warning in `chisq.test()`:
#> ! Chi-squared approximation may be incorrect
#> Warning: There was 1 warning in `dplyr::summarise()`.
#> ℹ In argument: `chisq.test(perfor.factor, mort_5yr)$p.value`.
#> Caused by warning in `chisq.test()`:
#> ! Chi-squared approximation may be incorrect
#> Missing data analysis: Mortality 5 year Not missing
#> Age (years) Mean (SD) 59.8 (11.9)
#> Age <40 years 67 (95.7)
#> 40-59 years 339 (98.5)
#> 60+ years 509 (98.8)
#> Extent of spread Submucosa 20 (95.2)
#> Muscle 103 (97.2)
#> Serosa 750 (98.8)
#> Adjacent structures 42 (97.7)
#> Perforation No 888 (98.4)
#> Yes 27 (100.0)
#> Missing p
#> 53.9 (12.7) 0.066
#> 3 (4.3) 0.132
#> 5 (1.5)
#> 6 (1.2)
#> 1 (4.8) 0.325
#> 3 (2.8)
#> 9 (1.2)
#> 1 (2.3)
#> 14 (1.6) 1.000
#> 0 (0.0)