Generate model predictions against a specified set of explanatory levels with
bootstrapped confidence intervals. Add a comparison by difference or ratio of
the first row of newdata with all subsequent rows.
boot_predict(
  fit,
  newdata,
  type = "response",
  R = 100,
  estimate_name = NULL,
  confint_level = 0.95,
  conf.method = "perc",
  confint_sep = " to ",
  condense = TRUE,
  boot_compare = TRUE,
  compare_name = NULL,
  comparison = "difference",
  ref_symbol = "-",
  digits = c(2, 3)
)
Arguments
- fit
- newdata
Dataframe usually generated with
finalfit_newdata.- type
the type of prediction required, see
predict.glm. The default for glm models is on the scale of the response variable. Thus for a binomial model the default predictions are predicted probabilities.- R
Number of simulations. Note default R=100 is very low.
- estimate_name
Name to be given to prediction variable y-hat.
- confint_level
The confidence level to use for the confidence interval. Must be strictly greater than 0 and less than 1. Defaults to 0.95, which corresponds to a 95 percent confidence interval.
- conf.method
Passed to the type argument of boot::boot.ci(). Defaults to "perc". The allowed types are "perc", "basic", "bca", and "norm". Does not support "stud" or "all"
- confint_sep
String separating lower and upper confidence interval
- condense
Logical. FALSE gives numeric values, usually for plotting. TRUE gives table for final output.
- boot_compare
Include a comparison with the first row of
newdatawith all subsequent rows. Seeboot_compare.- compare_name
Name to be given to comparison metric.
- comparison
Either "difference" or "ratio".
- ref_symbol
Reference level symbol
- digits
Rounding for estimate values and p-values, default c(2,3).
Value
A dataframe of predicted values and confidence intervals, with the
option of including a comparison of difference between first row and all
subsequent rows of newdata.
Details
To use this, first generate newdata for specified levels of
explanatory variables using finalfit_newdata. Pass model
objects from lm, glm, lmmulti, and
glmmulti. The comparison metrics are made on individual
bootstrap samples distribution returned as a mean with confidence intervals.
A p-value is generated on the proportion of values on the other side of the
null from the mean, e.g. for a ratio greater than 1.0, p is the number of
bootstrapped predictions under 1.0, multiplied by two so is two-sided.
See also
Examples
library(finalfit)
library(dplyr)
#>
#> Attaching package: ‘dplyr’
#> The following objects are masked from ‘package:stats’:
#>
#> filter, lag
#> The following objects are masked from ‘package:base’:
#>
#> intersect, setdiff, setequal, union
# Predict probability of death across combinations of factor levels
explanatory = c("age.factor", "extent.factor", "perfor.factor")
dependent = 'mort_5yr'
# Generate combination of factor levels
colon_s %>%
finalfit_newdata(explanatory = explanatory, newdata = list(
c("<40 years", "Submucosa", "No"),
c("<40 years", "Submucosa", "Yes"),
c("<40 years", "Adjacent structures", "No"),
c("<40 years", "Adjacent structures", "Yes")
)) -> newdata
# Run simulation
colon_s %>%
glmmulti(dependent, explanatory) %>%
boot_predict(newdata, estimate_name = "Predicted probability of death",
compare_name = "Absolute risk difference", R=100, digits = c(2,3))
#> Age Extent of spread Perforation Predicted probability of death
#> 1 <40 years Submucosa No 0.28 (0.06 to 0.55)
#> 2 <40 years Submucosa Yes 0.29 (0.05 to 0.56)
#> 3 <40 years Adjacent structures No 0.71 (0.55 to 0.89)
#> 4 <40 years Adjacent structures Yes 0.72 (0.40 to 0.87)
#> Absolute risk difference
#> 1 -
#> 2 0.00 (-0.12 to 0.18, p=0.960)
#> 3 0.45 (0.13 to 0.72, p<0.001)
#> 4 0.46 (0.16 to 0.74, p=0.020)
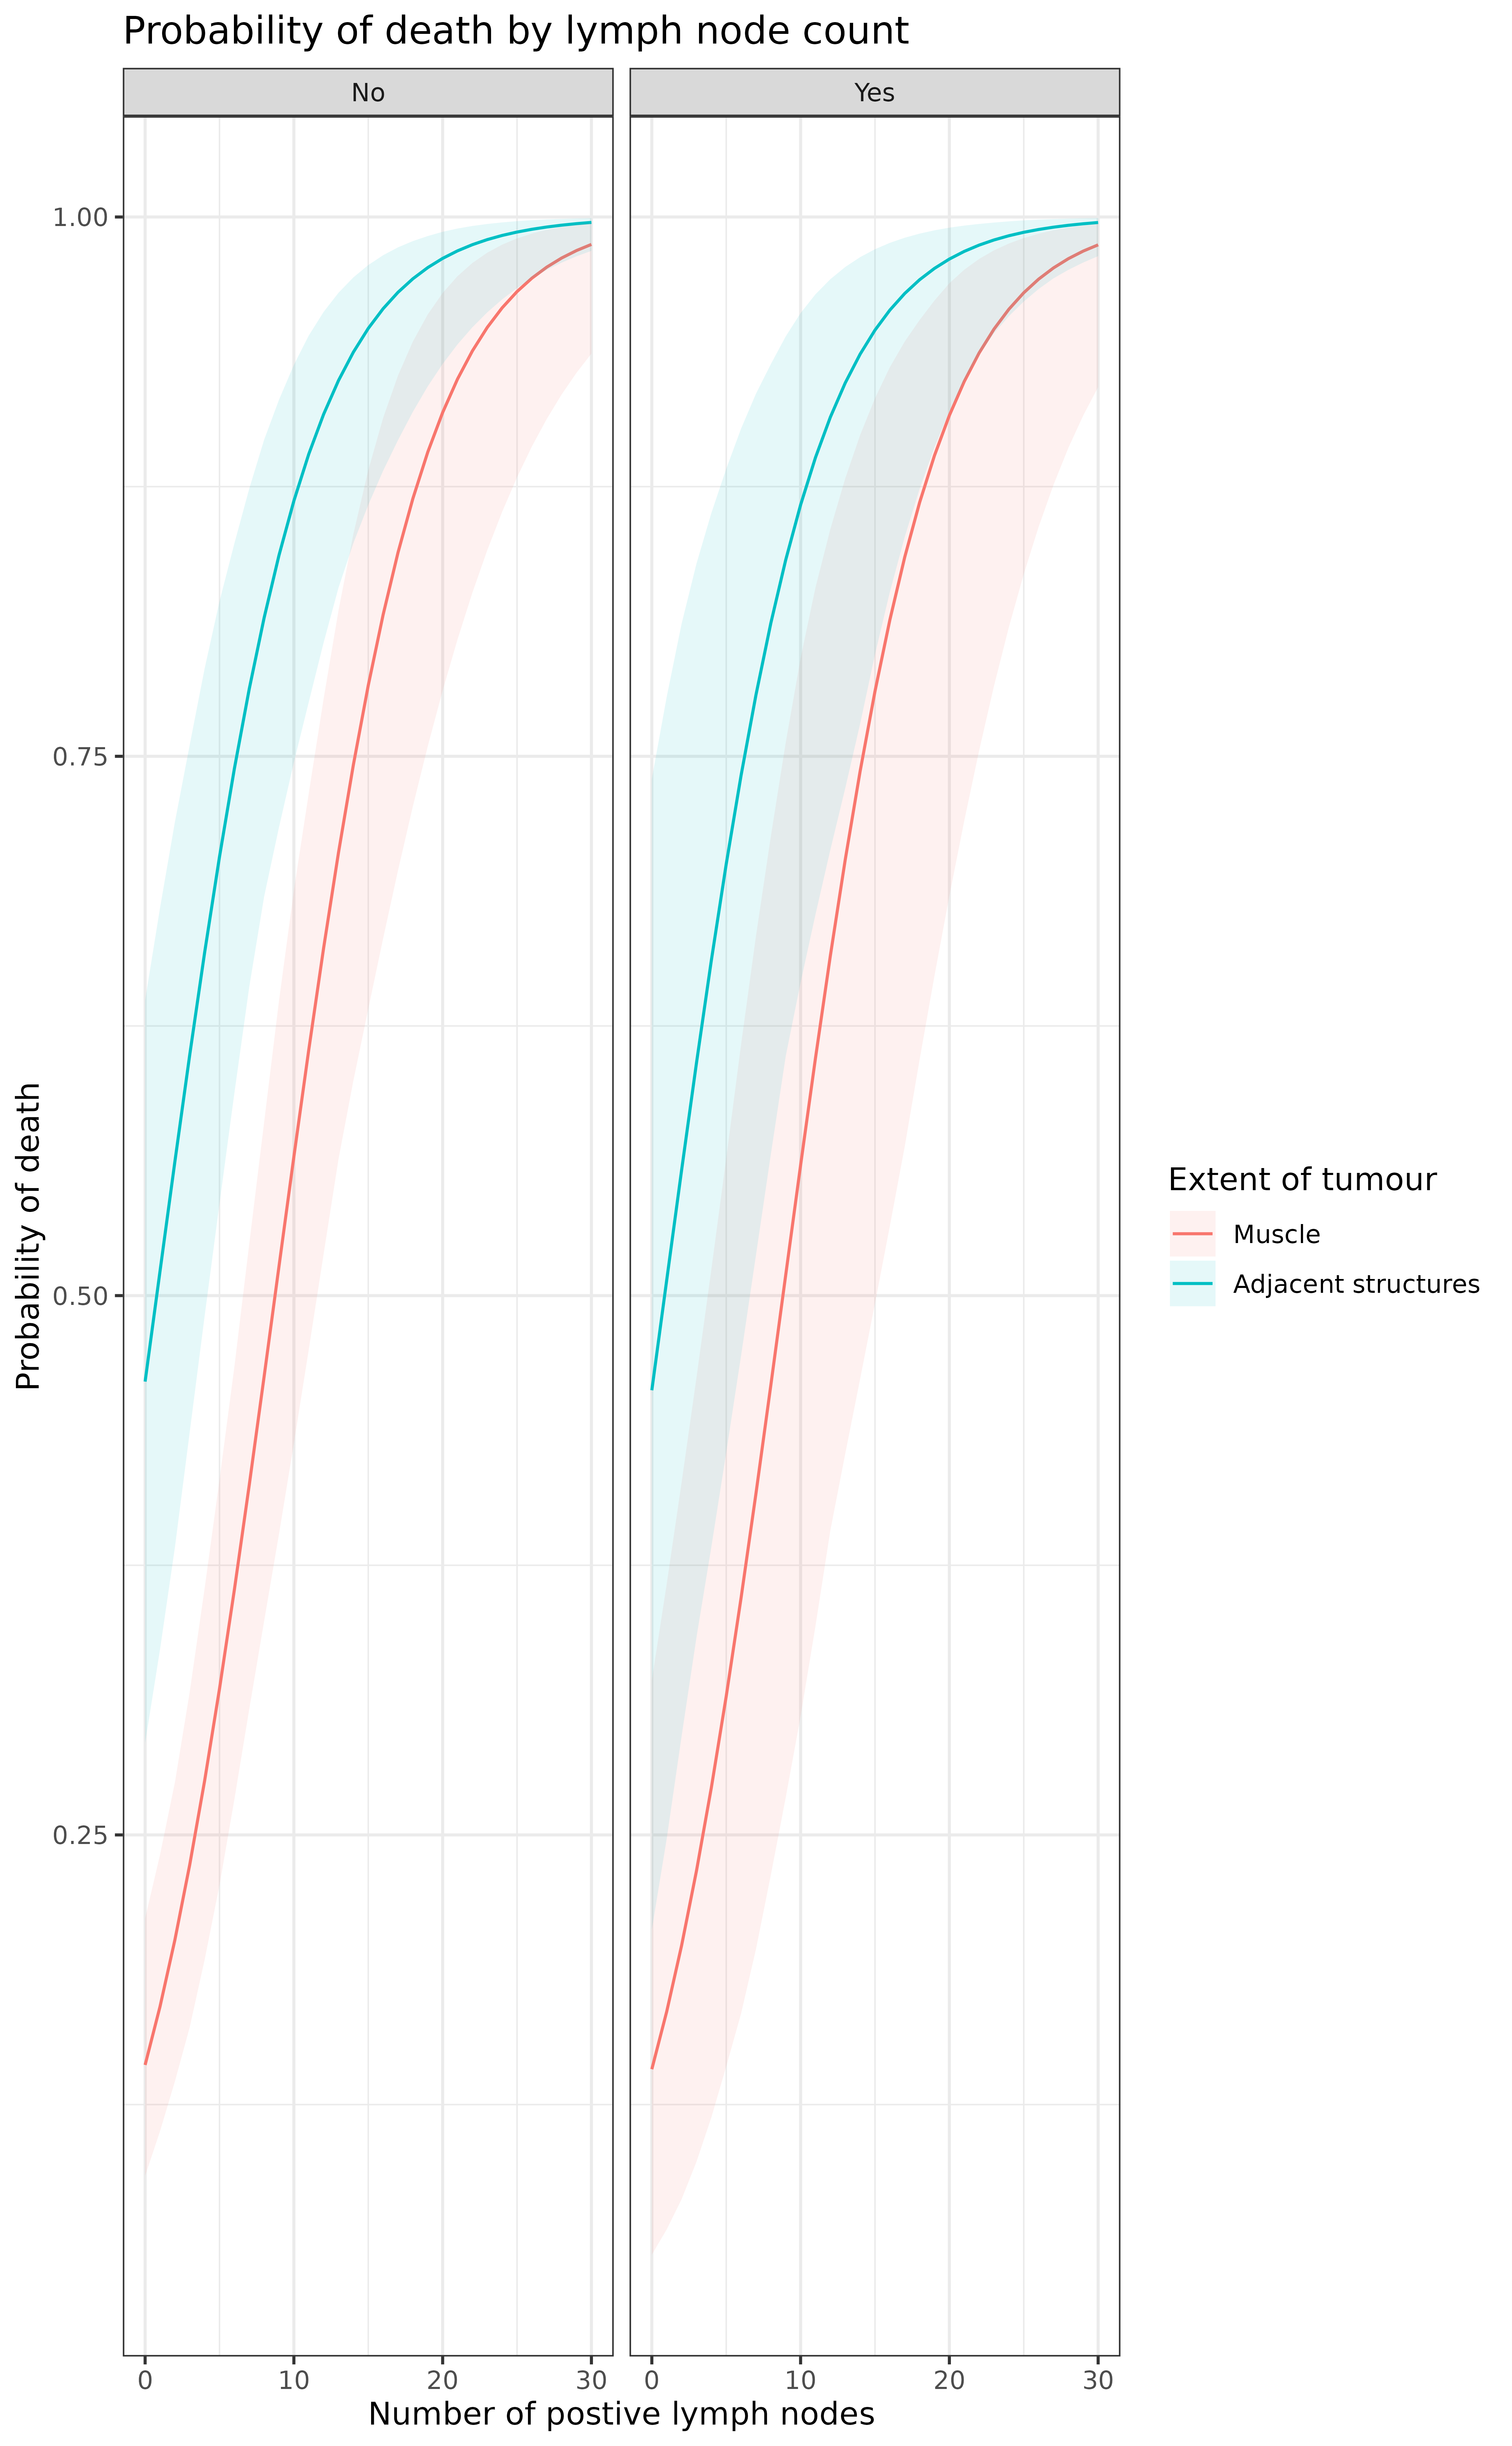
# Plotting
explanatory = c("nodes", "extent.factor", "perfor.factor")
colon_s %>%
finalfit_newdata(explanatory = explanatory, rowwise = FALSE, newdata = list(
rep(seq(0, 30), 4),
c(rep("Muscle", 62), rep("Adjacent structures", 62)),
c(rep("No", 31), rep("Yes", 31), rep("No", 31), rep("Yes", 31))
)) -> newdata
colon_s %>%
glmmulti(dependent, explanatory) %>%
boot_predict(newdata, boot_compare = FALSE, R=100, condense=FALSE) -> plot
library(ggplot2)
theme_set(theme_bw())
plot %>%
ggplot(aes(x = nodes, y = estimate, ymin = estimate_conf.low,
ymax = estimate_conf.high, fill=extent.factor))+
geom_line(aes(colour = extent.factor))+
geom_ribbon(alpha=0.1)+
facet_grid(.~perfor.factor)+
xlab("Number of postive lymph nodes")+
ylab("Probability of death")+
labs(fill = "Extent of tumour", colour = "Extent of tumour")+
ggtitle("Probability of death by lymph node count")
#> Warning: Combining variables of class <labelled> and <factor> was deprecated in ggplot2
#> 3.4.0.
#> ℹ Please ensure your variables are compatible before plotting (location:
#> `join_keys()`)