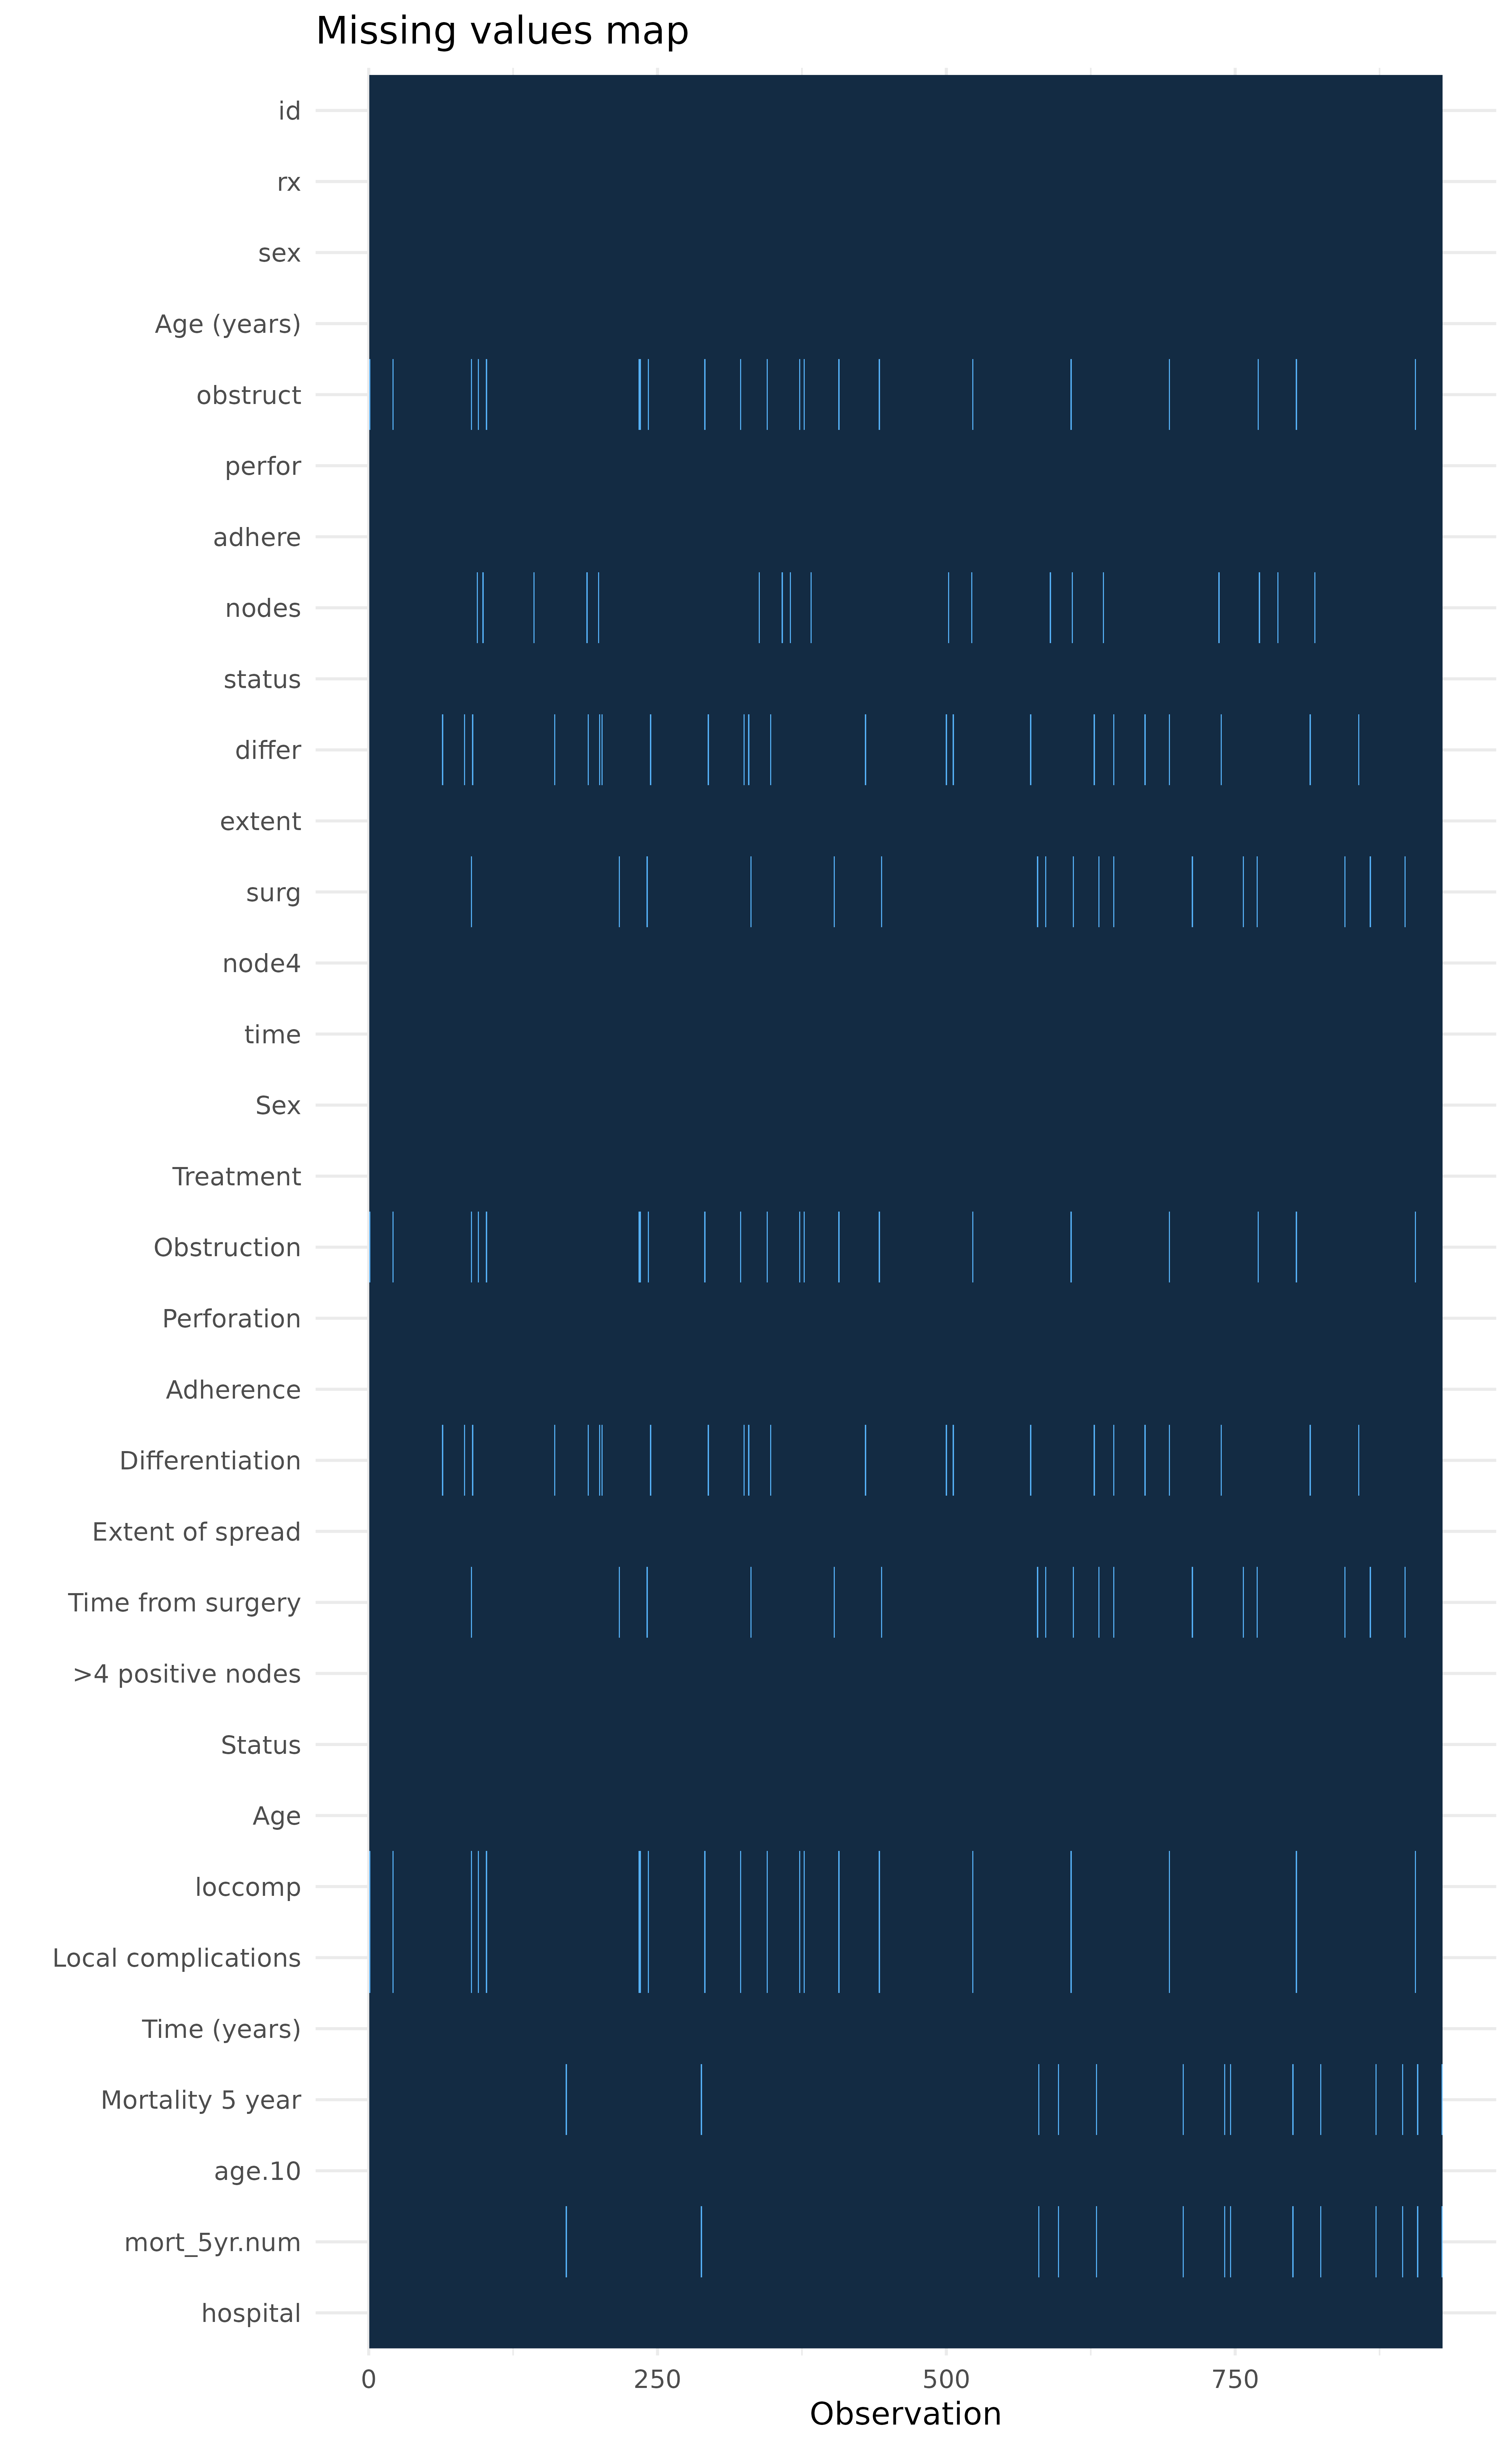
Create a plot of missing values by observations on the x-axis and variable on
the y-axis. Dependent and explanatory are for convenience and are optional.
missing_plot(
  .data,
  dependent = NULL,
  explanatory = NULL,
  use_labels = TRUE,
  title = NULL,
  plot_opts = NULL
)
Arguments
- .data
Data frame.
- dependent
Character vector. Optional name of dependent variable.
- explanatory
Character vector. Optional name(s) of explanatory variables.
- use_labels
Use variable label names in plot labelling.
- title
Character vector. Optional title for plot.
- plot_opts
A list of arguments to be appended to the ggplot call by "+".
Value
Heat map of missing values in dataset.
Examples
colon_s %>%
  missing_plot()